![]()
kube-prometheus 集合了 Kubernetes manifests, Grafana dashboards, and Prometheus rules,并结合文档和脚本,使用 Prometheus Operator 通过Prometheus提供易于操作的端到端 Kubernetes 集群监控。
此软件包中包含的组件:
此堆栈用于集群监控,因此它已预先配置为从所有 Kubernetes 组件收集指标。除此之外,它还提供一组默认的仪表板和警报规则。许多有用的仪表板和警报来自kubernetes-mixin 项目,与这个项目类似,它提供了可组合的 jsonnet 作为库供用户根据他们的需求进行定制。
您将需要一个 Kubernetes 集群,仅此而已!
该堆栈通过部署Prometheus Adapter提供resource metrics。此adapter是一个扩展 API 服务器,Kubernetes 需要启用此功能,否则适配器没有效果,但仍会部署。
支持以下 Kubernetes 版本并在我们在各自分支中针对这些版本进行测试时正常工作。但请注意,其他版本可能有效!
| kube-prometheus stack | Kubernetes 1.20 | Kubernetes 1.21 | Kubernetes 1.22 | Kubernetes 1.23 | Kubernetes 1.24 |
|---|---|---|---|---|---|
release-0.8 |
✔ | ✔ | ✗ | ✗ | ✗ |
release-0.9 |
✗ | ✔ | ✔ | ✗ | ✗ |
release-0.10 |
✗ | ✗ | ✔ | ✔ | ✗ |
release-0.11 |
✗ | ✗ | ✗ | ✔ | ✔ |
main |
✗ | ✗ | ✗ | ✗ | ✔ |
# 创建命名空间和CRD,然后等待它们可用再创建剩余资源
kubectl create -f manifests/setup
# 这里如果用kubectl apply -f manifests/setup,会报错:
# The CustomResourceDefinition "prometheuses.monitoring.coreos.com" is invalid: metadata.annotations: Too long: must have at most 262144 bytes

# Wait until the "servicemonitors" CRD is created. The message "No resources found" means success in this context.
# 直到“servicemonitors”CRD 创建完成。 消息 "No resources found" 意味着在此上下文中成功。
until kubectl get servicemonitors --all-namespaces ; do date; sleep 1; echo ""; done

# 更改镜像
如果客户环境只能连接国内网络,有下面两个镜像是拉取不到的,需要更改两个文件里的镜像内容

vi manifests/prometheusAdapter-deployment.yaml
将
image: k8s.gcr.io/prometheus-adapter/prometheus-adapter:v0.9.1
改为
image: registry.cn-hangzhou.aliyuncs.com/clab-docker/prometheus-operator:prometheus-adapterv91

vi manifests/kubeStateMetrics-deployment.yaml
将
image: k8s.gcr.io/kube-state-metrics/kube-state-metrics:v2.5.0
改为
image: registry.cn-hangzhou.aliyuncs.com/clab-docker/kube-state-metrics:v242

# 如果Grafana web放在域名子路径下如"https://app.xxx.com/grafana",需修改Grafana环境变量
vi manifests/grafana-deployment.yaml
    spec:
      containers:
      - env:
        - name: GF_SERVER_SERVE_FROM_SUB_PATH
          value: "true"
        - name: GF_SERVER_ROOT_URL
          value: "%(protocol)s://%(domain)s/grafana"

# 本地保留数据时长,默认为24h
vi manifests/prometheus-prometheus.yaml
spec:
  retention: 168h     <- 添加此行,168h(7天),可从manifests/setup/0prometheusCustomResourceDefinition.yaml找到定义

# 部署服务
kubectl create -f manifests/
查看服务
kubectl get pod -nmonitoring
移除 kube-prometheus
kubectl delete --ignore-not-found=true -f manifests/ -f manifests/setup
接收 prometheus 的 webhook 调用,然后通过钉钉 / 企业微信群机器人 webhook 发送通知。
部署 企业微信、钉钉 告警转发器
vi prometheus-webhook-deploy.yaml

- --adapter=/app/prometheusalert/dingtalk.js=/adapter/dingtalk=https://oapi.dingtalk.com/robot/send?access_token={token}#{secret}
- --adapter=/app/prometheusalert/wx.js=/adapter/wx=https://qyapi.weixin.qq.com/cgi-bin/webhook/send?key={key}
kubectl apply -f prometheus-webhook-deploy.yaml
调整 alertmanager receivers 到 企业微信、钉钉 告警转发器
vi alertmanager.yaml

receivers:
- name: wechat
  webhook_configs:
   - url: http://prometheus-webhook-dingtalk.monitoring.svc.cluster.local:8060/adapter/dingtalk
     send_resolved: false
   - url: http://prometheus-webhook-dingtalk.monitoring.svc.cluster.local:8060/adapter/wx
     send_resolved: false
kubectl get secret -n monitoring alertmanager-main
kubectl create secret generic alertmanager-main --from-file=alertmanager.yaml -n monitoring
kubectl rollout restart statefulset -n monitoring alertmanager-main
这部分用于介绍 Prometheus Operator, 不需要部署
Prometheus Operator 提供Kubernetes原生部署和Prometheus管理及相关监控组件。该项目的目的是 基于监控堆栈 为 Kubernetes 集群 简化和自动化 Prometheus 的配置。
Prometheus算子包括但不限于以下特性:
Prometheus Operator 的目标是尽可能简单地在 Kubernetes 上运行 Prometheus,同时保留 Kubernetes 原生配置选项。
本指南将向您展示如何部署 Prometheus 运算符、设置 Prometheus 实例以及为示例应用程序配置指标收集。
Prometheus Operator 需要使用 Kubernetes v1.16.x 及更高版本。
注:Operators 是CoreOS引入的一类操作其他软件的软件,将人类收集的操作知识放入软件中。
要遵循本指南,您需要一个具有管理员权限的 Kubernetes 集群。
第一步是安装operator的Custom Resource Definitions (CRDs)以及operator自身所需的 RBAC 资源。
运行以下命令以安装 CRD 并将 Operator 部署到default命名空间中:
LATEST=$(curl -s https://api.github.com/repos/prometheus-operator/prometheus-operator/releases/latest | jq -cr .tag_name)
curl -sL https://github.com/prometheus-operator/prometheus-operator/releases/download/${LATEST}/bundle.yaml | kubectl create -f -
operator可能需要几分钟才能启动并运行。您可以使用以下命令检查是否完成:
kubectl wait --for=condition=Ready pods -l app.kubernetes.io/name=prometheus-operator -n default
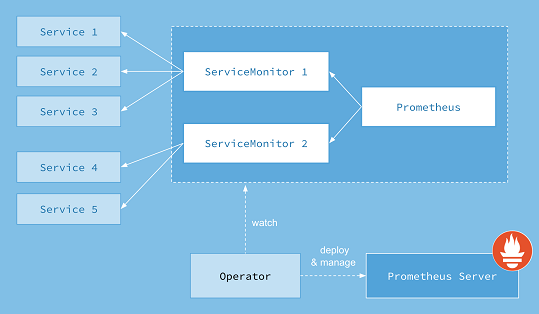
Prometheus Operator 在 Kubernetes 中引入自定义资源来声明 Prometheus 和 Alertmanager 集群的所需状态以及 Prometheus 配置。对于本指南,感兴趣的资源是:
PrometheusServiceMonitorPodMonitor资源Prometheus以声明方式描述了 Prometheus 部署的期望状态,而ServiceMonitor和PodMonitor资源描述了 Prometheus 监控的目标。
注意:查看警报指南以获取有关该资源的更多信息
Alertmanager。注意:查看设计页面,了解 Prometheus Operator 引入的所有资源的概览。
首先,让我们部署一个简单的示例应用程序,其中包含 3 个副本,用于侦听端口并公开指标8080。
apiVersion: apps/v1
kind: Deployment
metadata:
  name: example-app
spec:
  replicas: 3
  selector:
    matchLabels:
      app: example-app
  template:
    metadata:
      labels:
        app: example-app
    spec:
      containers:
      - name: example-app
        image: fabxc/instrumented_app
        ports:
        - name: web
          containerPort: 8080
让我们用一个 Service 对象公开应用程序,该对象选择所有app标签具有example-app值的 Pod。Service 对象还指定公开指标的端口。
kind: Service
apiVersion: v1
metadata:
  name: example-app
  labels:
    app: example-app
spec:
  selector:
    app: example-app
  ports:
  - name: web
    port: 8080
最后,我们创建一个 ServiceMonitor 对象,它选择所有带有app: example-app标签的服务对象。ServiceMonitor 对象还有一个team 标签(在本例中是team: frontend )来标识哪个团队负责监视应用程序/服务。
apiVersion: monitoring.coreos.com/v1
kind: ServiceMonitor
metadata:
  name: example-app
  labels:
    team: frontend
spec:
  selector:
    matchLabels:
      app: example-app
  endpoints:
  - port: web
如果 你的集群开启了RBAC授权,你必须先为Prometheus服务账号预先创建RBAC规则。
应用以下清单来创建服务帐户和所需的 ClusterRole/ClusterRoleBinding:
apiVersion: v1
kind: ServiceAccount
metadata:
  name: prometheus
apiVersion: rbac.authorization.k8s.io/v1
kind: ClusterRole
metadata:
  name: prometheus
rules:
- apiGroups: [""]
  resources:
  - nodes
  - nodes/metrics
  - services
  - endpoints
  - pods
  verbs: ["get", "list", "watch"]
- apiGroups: [""]
  resources:
  - configmaps
  verbs: ["get"]
- apiGroups:
  - networking.k8s.io
  resources:
  - ingresses
  verbs: ["get", "list", "watch"]
- nonResourceURLs: ["/metrics"]
  verbs: ["get"]
apiVersion: rbac.authorization.k8s.io/v1
kind: ClusterRoleBinding
metadata:
  name: prometheus
roleRef:
  apiGroup: rbac.authorization.k8s.io
  kind: ClusterRole
  name: prometheus
subjects:
- kind: ServiceAccount
  name: prometheus
  namespace: default
有关详细信息,请参阅Prometheus Operator RBAC 指南。
Prometheus 自定义资源定义了底层具体 StatefulSet 的特征(副本数、资源请求/限制……)以及 spec.serviceMonitorSelector字段中应包含哪些 ServiceMonitors。
之前,我们已经创建了带有team: frontend 标签的 ServiceMonitor 对象,这里我们定义 Prometheus 对象应该选择所有带有team: frontend标签的 ServiceMonitor。这使前端团队能够创建新的 ServiceMonitors 和服务,而无需重新配置 Prometheus 对象。
apiVersion: monitoring.coreos.com/v1
kind: Prometheus
metadata:
  name: prometheus
spec:
  serviceAccountName: prometheus
  serviceMonitorSelector:
    matchLabels:
      team: frontend
  resources:
    requests:
      memory: 400Mi
  enableAdminAPI: false
要验证实例是否已启动并正在运行,请运行:
kubectl get -n default prometheus prometheus -w
默认情况下,Prometheus 只会从当前命名空间中获取 ServiceMonitors。要从其他命名空间中选择 ServiceMonitors,您可以更新Prometheus 资源的spec.serviceMonitorNamespaceSelector字段。
我们可以使用不需要创建 Kubernetes 服务的 PodMonitor 来代替 ServiceMonitor。实际上,spec.selector标签会告诉 Prometheus 应该抓取哪些 Pod。
apiVersion: monitoring.coreos.com/v1
kind: PodMonitor
metadata:
  name: example-app
  labels:
    team: frontend
spec:
  selector:
    matchLabels:
      app: example-app
  podMetricsEndpoints:
  - port: web
类似地,Prometheus 对象定义了使用该字段选择哪些 PodMonitor spec.podMonitorSelector。
apiVersion: monitoring.coreos.com/v1
kind: Prometheus
metadata:
  name: prometheus
spec:
  serviceAccountName: prometheus
  podMonitorSelector:
    matchLabels:
      team: frontend
  resources:
    requests:
      memory: 400Mi
  enableAdminAPI: false
要访问 Prometheus 接口,您必须将服务暴露给外部。为简单起见,我们使用NodePort服务。
apiVersion: v1
kind: Service
metadata:
  name: prometheus
spec:
  type: NodePort
  ports:
  - name: web
    nodePort: 30900
    port: 9090
    protocol: TCP
    targetPort: web
  selector:
    prometheus: prometheus
创建服务后,Prometheus Web 服务器在节点的 IP 地址下的端口上可用30900。Web 界面中的 Targets 页面应显示已成功发现示例应用程序的实例。
注意:以这种方式公开 Prometheus Web 服务器可能不是一个适用的解决方案。在Ingress 指南中阅读有关可能选项的更多信息。
Prometheus Admin API 允许访问特定时间范围内的删除系列、清理墓碑、捕获快照等。有关管理 API 的更多信息可以在Prometheus 官方文档中找到。默认情况下,此 API 访问是禁用的,可以使用 此布尔标志进行切换. 以下示例公开了管理 API:
警告:启用管理 API 会启用更改端点、删除数据、关闭 Prometheus 等。应谨慎启用此功能,建议用户通过代理添加额外的身份验证/授权,以确保只有授权执行这些操作的客户端才能这样做。
apiVersion: monitoring.coreos.com/v1
kind: Prometheus
metadata:
  name: prometheus
spec:
  serviceAccountName: prometheus
  serviceMonitorSelector:
    matchLabels:
      team: frontend
  resources:
    requests:
      memory: 400Mi
  enableAdminAPI: true
本指南假定您对 Prometheus 运算符有基本的了解,并且您已经遵循了入门指南。
Prometheus Operator 需要使用 Kubernetes v1.16.x 及更高版本。
Prometheus Operator 引入了一种Alertmanager资源,它允许用户以声明方式描述 Alertmanager 集群。要成功部署 Alertmanager 集群,了解 Prometheus 和 Alertmanager 之间的协议很重要。Alertmanager 用于:
Prometheus Operator 还引入了一种AlertmanagerConfig资源,它允许用户以声明方式描述 Alertmanager 配置。
注意:AlertmanagerConfig 资源目前是 v1alpha1,欢迎测试和反馈。
Prometheus 的配置还包括“规则文件”,其中包含 警报规则。当警报规则触发时,它会在每个规则评估间隔针对所有Alertmanager 实例触发该警报。Alertmanager 实例相互通信哪些通知已经发出。有关此系统设计的更多信息,请参阅高可用性 页面。
您有一个正在运行的 Prometheus 运算符。
首先,让我们创建一个包含三个副本的 Alertmanager 集群:
apiVersion: monitoring.coreos.com/v1
kind: Alertmanager
metadata:
  name: example
spec:
  replicas: 3
等待所有 Alertmanager pod 准备就绪:
kubectl get pods -l alertmanager=example -w
默认情况下,Alertmanager 实例将以最小配置开始,这并不是很有用,因为它在接收警报时不发送任何通知。
您有几个选项来提供Alertmanager configuration:
spec.alertmanagerConfiguration在定义main Alertmanager configuration的同一命名空间中引用 AlertmanagerConfig 对象。spec.alertmanagerConfigSelector和 spec.alertmanagerConfigNamespaceSelector告诉operator应选择哪些 AlertmanagerConfigs 对象并将其与main Alertmanager configuration合并。以下native Alertmanager configuration将通知发送到虚构的 webhook 服务:
route:
  group_by: ['job']
  group_wait: 30s
  group_interval: 5m
  repeat_interval: 12h
  receiver: 'webhook'
receivers:
- name: 'webhook'
  webhook_configs:
  - url: 'http://example.com/'
将上述配置保存在alertmanager.yaml本地目录中调用的文件中,并从中创建一个 Secret:
kubectl create secret generic alertmanager-example --from-file=alertmanager.yaml
Prometheus operator 要求 Secret 的名称类似于 alertmanager-{ALERTMANAGER_NAME}. 在前面的示例中,Alertmanager 的名称是example,因此机密名称必须是alertmanager-example。在 Secret 中保存配置数据的密钥的名称必须是 alertmanager.yaml.
注意:如果你想使用不同的秘密名称,你可以
spec.configSecret在 Alertmanager 资源中的字段中指定它。
Alertmanager configuration可能会引用磁盘上的自定义模板或密码文件。这些可以与alertmanager.yaml 配置文件一起添加到 Secret 中。例如,假设我们有以下 Secret:
apiVersion: v1
kind: Secret
metadata:
  name: alertmanager-example
data:
  alertmanager.yaml: {BASE64_CONFIG}
  template_1.tmpl: {BASE64_TEMPLATE_1}
  template_2.tmpl: {BASE64_TEMPLATE_2}
该目录下的 Alertmanager 容器将可以访问模板 /etc/alertmanager/config。Alertmanager 配置可以像这样引用它们:
templates:
- '/etc/alertmanager/config/*.tmpl'
以下示例配置创建了一个 AlertmanagerConfig 资源,用于向虚构的 webhook 服务发送通知。
apiVersion: monitoring.coreos.com/v1alpha1
kind: AlertmanagerConfig
metadata:
  name: config-example
  labels:
    alertmanagerConfig: example
spec:
  route:
    groupBy: ['job']
    groupWait: 30s
    groupInterval: 5m
    repeatInterval: 12h
    receiver: 'webhook'
  receivers:
  - name: 'webhook'
    webhookConfigs:
    - url: 'http://example.com/'
在集群中创建 AlertmanagerConfig 资源:
curl -sL https://raw.githubusercontent.com/prometheus-operator/prometheus-operator/main/example/user-guides/alerting/alertmanager-config-example.yaml | kubectl create -f -
Alertmanager 资源中的spec.alertmanagerConfigSelector字段需要更新,以便操作员选择 AlertmanagerConfig 资源。在前面的示例中,alertmanagerConfig: example添加了标签,因此 Alertmanager 对象应该像这样更新:
apiVersion: monitoring.coreos.com/v1
kind: Alertmanager
metadata:
  name: example
spec:
  replicas: 3
  alertmanagerConfigSelector:
    matchLabels:
      alertmanagerConfig: example
以下示例配置创建了一个 Alertmanager 资源,该资源使用要用于 Alertmanager configuration的 AlertmanagerConfig 资源而不是alertmanager-examplesecret。
apiVersion: monitoring.coreos.com/v1
kind: Alertmanager
metadata:
  name: example
  namespace: default
spec:
  replicas: 3
  alertmanagerConfiguration:
    name: config-example
在命名空间default 中名为example-config的 AlertmanagerConfig 资源将是一个全局 AlertmanagerConfig。当operator从中生成 Alertmanager configuration时,不会对路由和禁止规则强制执行命名空间标签。
要访问 Alertmanager 接口,您必须将服务暴露给外部。为简单起见,我们使用NodePort服务。
apiVersion: v1
kind: Service
metadata:
  name: alertmanager-example
spec:
  type: NodePort
  ports:
  - name: web
    nodePort: 30903
    port: 9093
    protocol: TCP
    targetPort: web
  selector:
    alertmanager: example
创建服务后,Alertmanager Web 服务器在端口上的节点 IP 地址下可用30903。
注意:以这种方式公开 Alertmanager Web 服务器可能不是一个适用的解决方案。在Ingress 指南中阅读有关可能选项的更多信息。
这个 Alertmanager 集群现在功能齐全且高度可用,但没有针对它发出警报。
首先,创建一个将向 Alertmanger 集群发送警报的 Prometheus 实例:
apiVersion: monitoring.coreos.com/v1
kind: Prometheus
metadata:
  name: example
spec:
  serviceAccountName: prometheus
  replicas: 2
  alerting:
    alertmanagers:
    - namespace: default
      name: alertmanager-example
      port: web
  serviceMonitorSelector:
    matchLabels:
      team: frontend
  ruleSelector:
    matchLabels:
      role: alert-rules
      prometheus: example
该Prometheus资源发现之前创建的所有Alertmanager 实例Service(注意name、namespace和port字段应与Alertmanager Service 的定义相匹配)。
打开 Prometheus web 界面,进入“Status > Runtime & Build Information”页面,检查 Prometheus 是否发现了 3 个 Alertmanager 实例。
PrometheusRuleCRD 允许定义警报和记录规则。operator知道根据spec.ruleSelector字段为给定的 Prometheus 选择哪些 PrometheusRule 对象。
注意:默认情况下,
spec.ruleSelector是 nil 表示operator不选择任何规则。
默认情况下,Prometheus 资源仅发现PrometheusRule同一命名空间中的资源。这可以通过ruleNamespaceSelector字段进行细化:
ruleNamespaceSelector: {})。matchLabels字段。从具有team=frontend标签的所有名称空间中发现role=alert-rules和prometheus=example标签的PrometheusRule资源:
apiVersion: monitoring.coreos.com/v1
kind: Prometheus
metadata:
  name: example
spec:
  serviceAccountName: prometheus
  replicas: 2
  alerting:
    alertmanagers:
    - namespace: default
      name: alertmanager-example
      port: web
  serviceMonitorSelector:
    matchLabels:
      team: frontend
  ruleSelector:
    matchLabels:
      role: alert-rules
      prometheus: example
  ruleNamespaceSelector:
    matchLabels:
      team: frontend
如果你想通过名称选择单个命名空间,你可以使用 kubernetes.io/metadata.name标签,它会自动填充 NamespaceDefaultLabelName 功能门。
从以下manifest创建一个 PrometheusRule 对象。请注意,对象的标签与具有spec.ruleSelector标签的Prometheus 对象的标签相匹配。
apiVersion: monitoring.coreos.com/v1
kind: PrometheusRule
metadata:
  creationTimestamp: null
  labels:
    prometheus: example
    role: alert-rules
  name: prometheus-example-rules
spec:
  groups:
  - name: ./example.rules
    rules:
    - alert: ExampleAlert
      expr: vector(1)
出于演示目的,PrometheusRule 对象始终会触发 ExampleAlert警报。要验证一切是否正常工作,您可以再次打开 Prometheus Web 界面并转到警报页面。
接下来打开 Alertmanager Web 界面并检查它是否显示一个活动警报。