![]()
Graylog是一个开源的日志聚合、分析、审计、展现和预警工具。Graylog完全基于JAVA代码编写,运行时需要依赖JDK。
零开发:从收集->存储->分析->呈现完整流程。
部署维护简单:一体化解决方案,不像ELK三个独立系统集成。
多日志源接入:syslog、Filebeat、Log4j、Logstash等。
多协议接入:UDP、TCP、HTTP、AMQP。
自定义面板:提供曲线图、饼状图、世界地图等丰富的图形列表。
全文搜索:支持按语法进行过滤搜索全部日志。
支持报警:具有报警功能的日志分析平台。
权限管理:灵活的权限分配和管理。
支持集群:可以根据应用扩展平台性能。
Graylog 提供Graylog对外接口,提供用户界面;
Elasticsearch 日志文件的持久化存储、检索;
MongoDB 存储元信息和配置数据;
Prometheus 日志告警。
在为Graylog扩展资源时,有一些经验法则:
Graylog节点应重点关注CPU功能。这些还可以为浏览器提供用户界面。
Elasticsearch节点应具有尽可能多的RAM和可以获得的最快磁盘。一切都取决于此处的I/O速度。
MongoDB存储元信息和配置数据,不需要很多资源。
这是最小化的Graylog安装,可用于较小,非关键或测试的设置。没有多余的组件,可以简单且快速安装。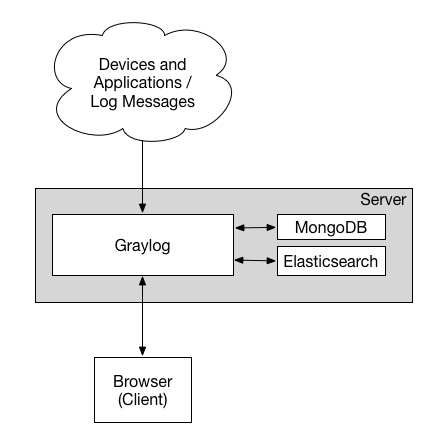
这是用于较大生产环境的安装方式。它在负载均衡器后面有几个Graylog节点,用于分配处理负载。
负载均衡器可以通过Graylog REST API上的HTTP来对Graylog节点执行ping操作,以检查它们是否仍在运行并将死节点从群集中删除。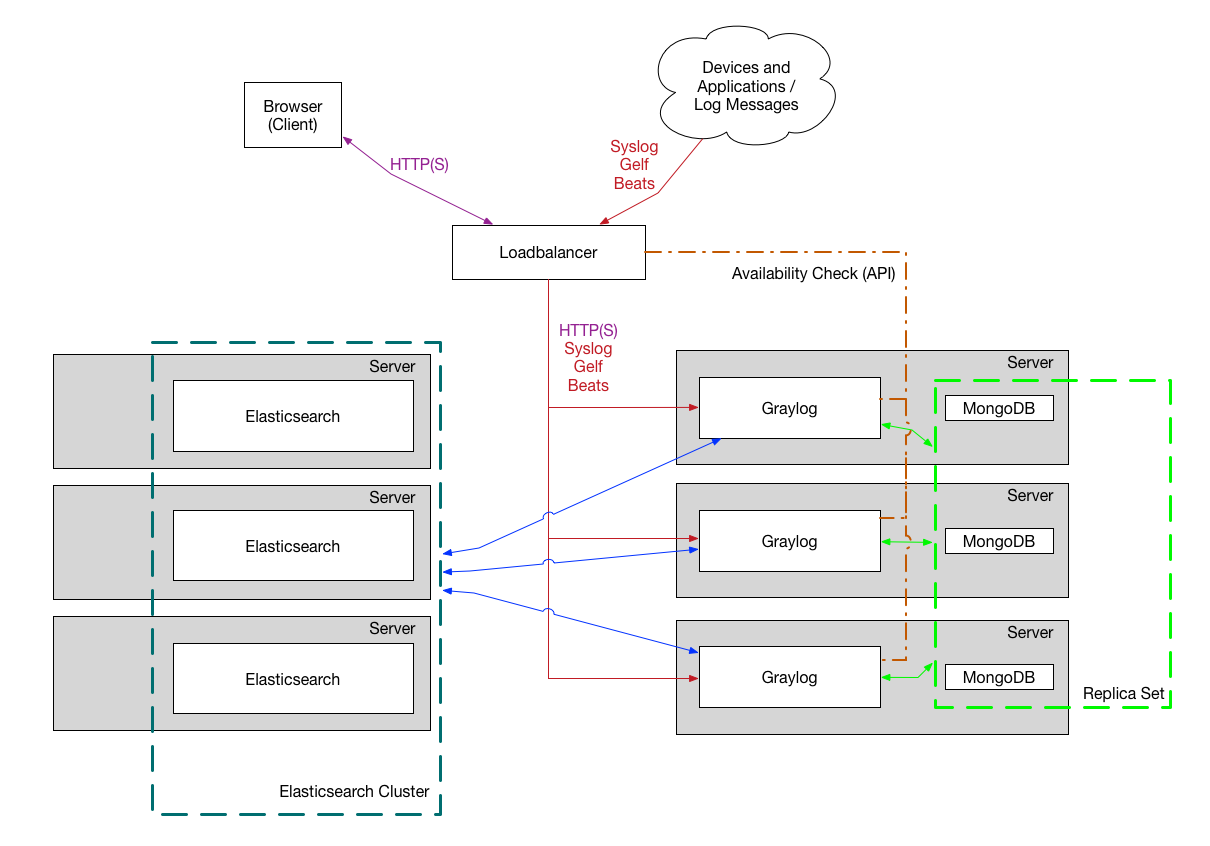
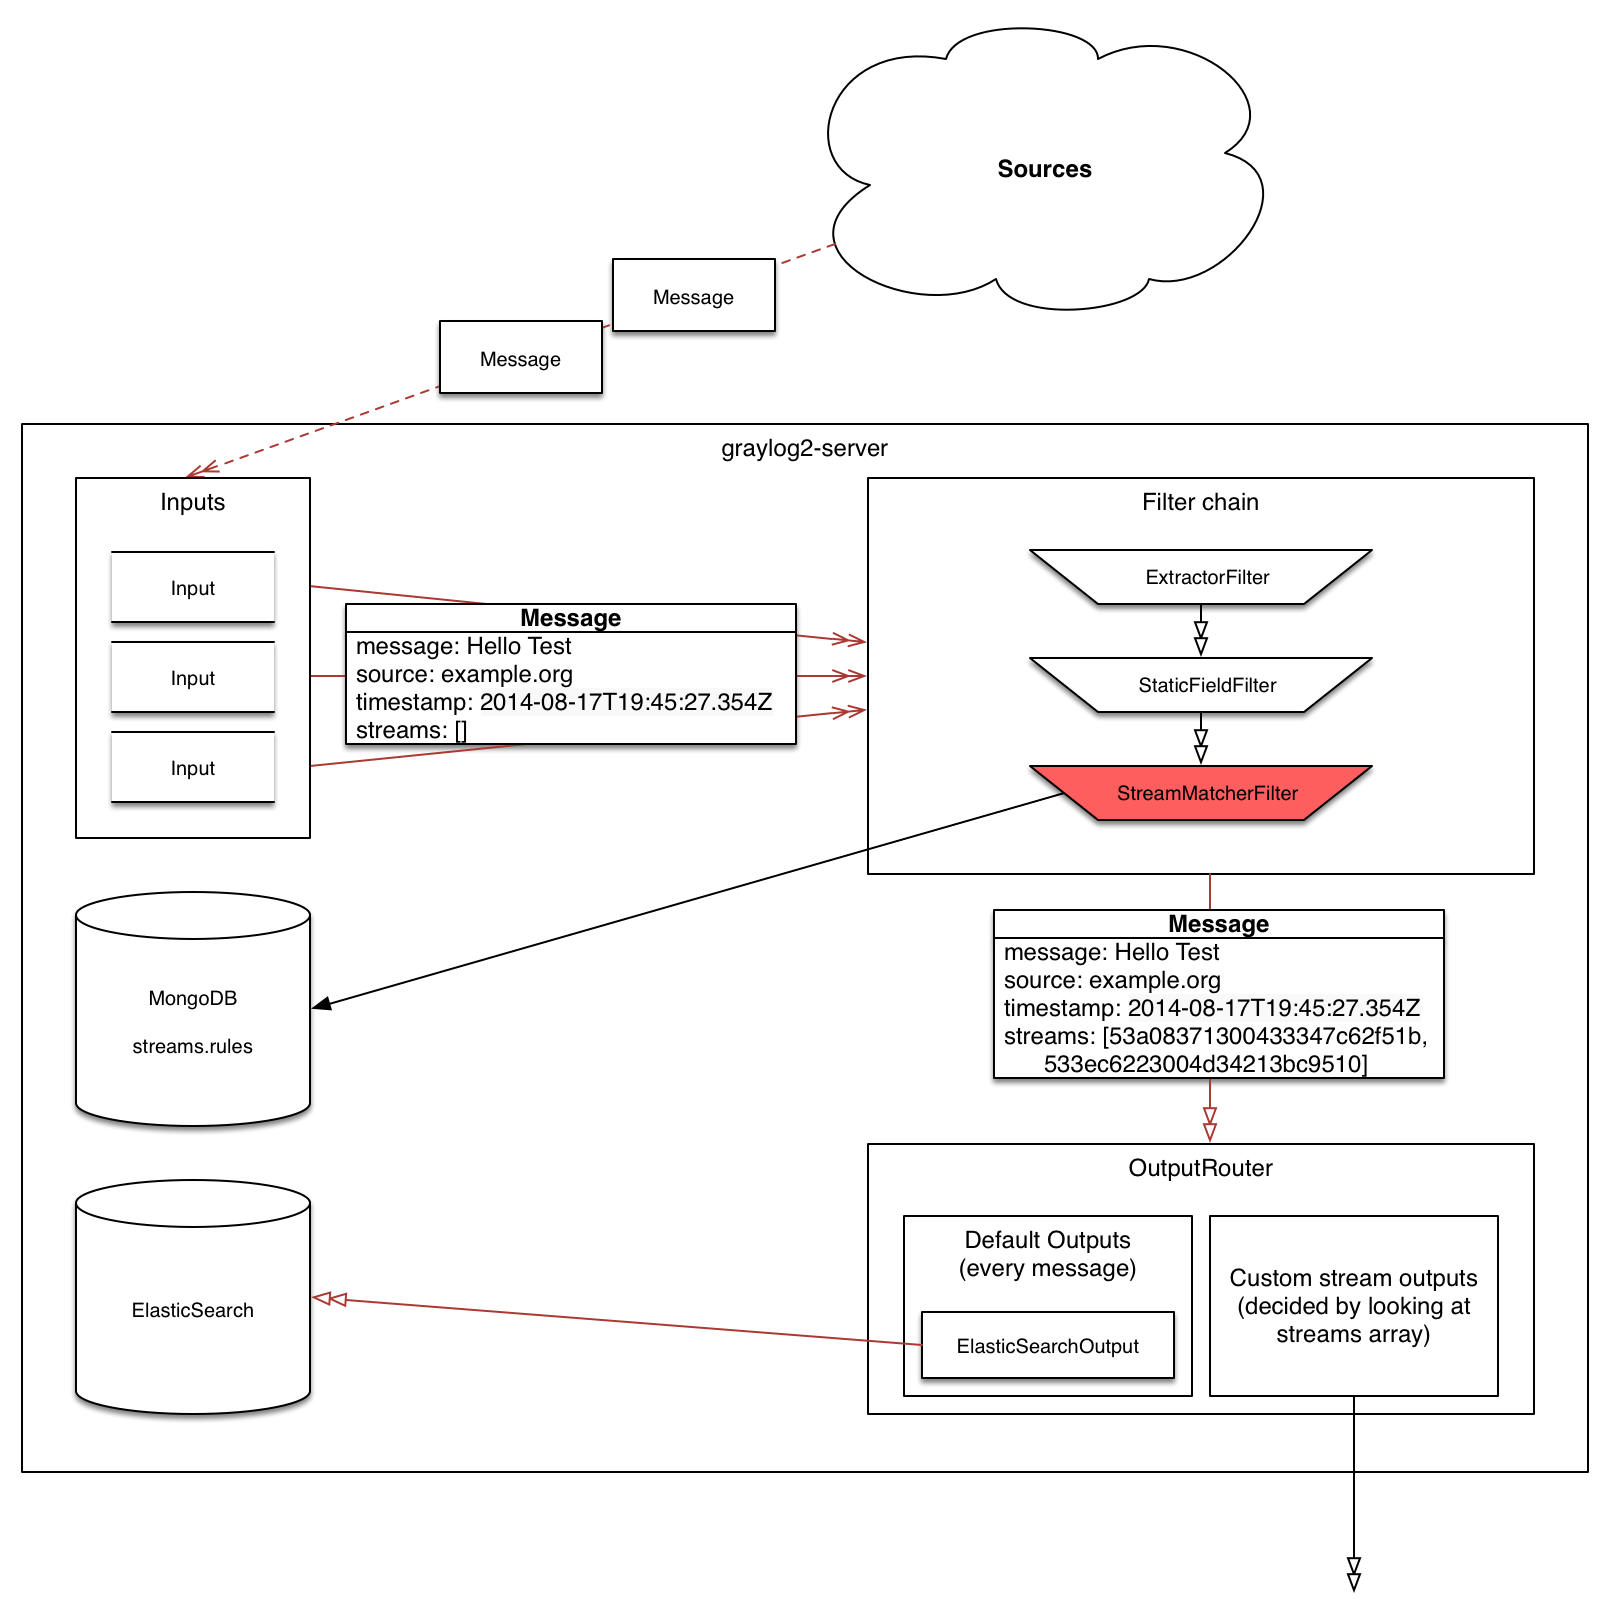
Graylog日志系统除了Graylog server,还包括代理程序(graylog sidecar)第三方日志收集器(如:filebeat、syslog),主要数据流如下图
日志采集器将一条日志信息发送给Graylog,主要经过如下处理过程:
github
Graylog对基础软件的版本要求如下:
sudo yum install java-1.8.0-openjdk-headless.x86_64
/etc/yum.repos.d/mongodb-org.repo

[mongodb-org-4.0]
name=MongoDB Repository
baseurl=https://repo.mongodb.org/yum/redhat/$releasever/mongodb-org/4.0/x86_64/
gpgcheck=1
enabled=1
gpgkey=https://www.mongodb.org/static/pgp/server-4.0.asc

sudo yum install mongodb-org

sudo systemctl daemon-reload
sudo systemctl enable mongod.service
sudo systemctl restart mongod.service
sudo systemctl status mongod.service
sudo systemctl stop mongod.service

sudo chkconfig --add mongod
sudo chkconfig mongod on
sudo service mongod restart
sudo service mongod status
sudo service mongod stop
rpm --import https://artifacts.elastic.co/GPG-KEY-elasticsearch
vi /etc/yum.repos.d/elasticsearch.repo

[elasticsearch-6.x]
name=Elasticsearch repository for 6.x packages
baseurl=https://artifacts.elastic.co/packages/oss-6.x/yum
gpgcheck=1
gpgkey=https://artifacts.elastic.co/GPG-KEY-elasticsearch
enabled=1
autorefresh=1
type=rpm-md

[elasticsearch]
name=Elasticsearch repository for 7.x packages
baseurl=https://artifacts.elastic.co/packages/7.x/yum
gpgcheck=1
gpgkey=https://artifacts.elastic.co/GPG-KEY-elasticsearch
enabled=1
autorefresh=1
type=rpm-md

https://mirrors.tuna.tsinghua.edu.cn/elasticstack/

[elasticsearch]
name=Elasticsearch repository for 7.x packages
baseurl=https://mirrors.tuna.tsinghua.edu.cn/elasticstack/7.x/yum
gpgcheck=0
gpgkey=https://artifacts.elastic.co/GPG-KEY-elasticsearch
enabled=1
autorefresh=1
type=rpm-md

sudo yum install elasticsearch-oss
vi /etc/elasticsearch/elasticsearch.yml

Cluster name settingedit
集群名称设置

A node can only join a cluster when it shares its cluster.name with all the other nodes in the cluster. The default name is elasticsearch, but you should change it to an appropriate name that describes the purpose of the cluster.

cluster.name: logging-prod
Do not reuse the same cluster names in different environments. Otherwise, nodes might join the wrong cluster.
当节点与集群中的所有其他节点共享其cluster.name时,该节点只能加入集群。默认名称是elasticsearch,但是您应该将其更改为描述集群用途的适当名称。


Node name setting
节点名称设置

Elasticsearch uses node.name as a human-readable identifier for a particular instance of Elasticsearch. This name is included in the response of many APIs. The node name defaults to the hostname of the machine when Elasticsearch starts, but can be configured explicitly in elasticsearch.yml:
Elasticsearch使用node.name作为Elasticsearch特定实例的人类可读标识符。此名称包含在许多API的响应中。当Elasticsearch启动时,节点名称默认为计算机的主机名,但可以在elasticsearch.yml中显式配置:

node.name: prod-data-2


Network host setting
网络主机设置

By default, Elasticsearch only binds to loopback addresses such as 127.0.0.1 and [::1]. This is sufficient to run a cluster of one or more nodes on a single server for development and testing, but a resilient production cluster must involve nodes on other servers. There are many network settings but usually all you need to configure is network.host:
默认情况下,Elasticsearch仅绑定到环回地址,例如127.0.0.1和[:: 1]。这足以在单个服务器上运行一个或多个节点的集群以进行开发和测试,但是弹性生产集群必须涉及其他服务器上的节点。网络设置很多,但通常只需配置network.host:

network.host: 192.168.1.10

When you provide a value for network.host, Elasticsearch assumes that you are moving from development mode to production mode, and upgrades a number of system startup checks from warnings to exceptions. See the differences between development and production modes.
★★★当您提供network.host的值时,Elasticsearch会假定您正在从开发模式转换为生产模式,并将许多系统启动检查从警告升级为异常。查看开发和生产模式之间的差异。

★★★这些异常将阻止您的Elasticsearch节点启动。 这是一项重要的安全措施,可确保您不会因服务器配置错误而丢失数据。

network.bind_host: 192.168.0.1
设置绑定的ip地址,可以是ipv4或ipv6的,默认为0.0.0.0。

network.publish_host: 192.168.0.1
设置其它节点和该节点交互的ip地址,如果不设置它会自动判断,值必须是个真实的ip地址。

network.host: 192.168.0.1
这个参数是用来同时设置bind_host和publish_host上面两个参数。


Discovery and cluster formation settings
发现和集群形成设置

Configure two important discovery and cluster formation settings before going to production so that nodes in the cluster can discover each other and elect a master node.
在投入生产之前,请配置两个重要的发现和集群形成设置,以便集群中的节点可以彼此发现并选举一个主节点。

★★★discovery.seed_hosts 和  discovery.initial_master_nodes只设置master节点配置,纯data节点不写。

discovery.seed_hosts
对应旧版中的discovery.zen.ping.unicast.hosts

Out of the box, without any network configuration, Elasticsearch will bind to the available loopback addresses and scan local ports 9300 to 9305 to connect with other nodes running on the same server. This behavior provides an auto-clustering experience without having to do any configuration.
开箱即用,无需任何网络配置,Elasticsearch将绑定到可用的环回地址并扫描本地端口9300至9305,以与在同一服务器上运行的其他节点连接。此行为无需进行任何配置即可提供自动群集体验。

When you want to form a cluster with nodes on other hosts, use the static discovery.seed_hosts setting. This setting provides a list of other nodes in the cluster that are master-eligible and likely to be live and contactable to seed the discovery process. This setting accepts a YAML sequence or array of the addresses of all the master-eligible nodes in the cluster. Each address can be either an IP address or a hostname that resolves to one or more IP addresses via DNS.
如果要与其他主机上的节点组成集群,请使用静态 Discovery.seed_hosts设置。此设置提供了群集中其他主机节点的列表,这些节点符合候选主节点,并且可能处于活动状态并且可以联系以播种发现过程。此设置接受群集中所有主资格节点的YAML序列或地址数组。每个地址可以是IP地址,也可以是通过DNS解析为一个或多个IP地址的主机名。

discovery.seed_hosts:
   - 192.168.1.10:9300
   - 192.168.1.11
   - seeds.mydomain.com
   - [0:0:0:0:0:ffff:c0a8:10c]:9301

discovery.seed_hosts: ["es-01", "es-02"]

discovery.seed_hosts: ["10.10.100.119", "10.10.100.120"]

如果配置为域名,需写入/etc/hosts
es-01   10.10.100.119
es-02   10.10.100.120

The port is optional and defaults to 9300, but can be overridden.
该端口是可选的,默认为9300,但可以覆盖。

If a hostname resolves to multiple IP addresses, the node will attempt to discover other nodes at all resolved addresses.
如果主机名解析为多个IP地址,则该节点将尝试在所有解析的地址处发现其他节点。

IPv6 addresses must be enclosed in square brackets.
IPv6地址必须放在方括号中。

If your master-eligible nodes do not have fixed names or addresses, use an alternative hosts provider to find their addresses dynamically.
如果符合主机资格的节点没有固定的名称或地址,请使用备用主机提供程序动态查找其地址。

cluster.initial_master_nodes
这是7.*新引入的配置项。

When you start an Elasticsearch cluster for the first time, a cluster bootstrapping step determines the set of master-eligible nodes whose votes are counted in the first election. In development mode, with no discovery settings configured, this step is performed automatically by the nodes themselves.
首次启动Elasticsearch集群时,集群引导步骤将确定其主节点符合资格的节点集,该节点的票数将在第一次选举中进行计数。在开发模式下,未配置发现设置,此步骤由节点自身自动执行。

Because auto-bootstrapping is inherently unsafe, when starting a new cluster in production mode, you must explicitly list the master-eligible nodes whose votes should be counted in the very first election. You set this list using the cluster.initial_master_nodes setting.
因为自动引导本质上是不安全的,所以在生产模式下启动新集群时,必须明确列出要在第一个选举中计算其票数的符合主机资格的节点。您可以使用cluster.initial_master_nodes设置来设置此列表。

After the cluster forms successfully for the first time, remove the cluster.initial_master_nodes setting from each nodes' configuration. Do not use this setting when restarting a cluster or adding a new node to an existing cluster.
集群首次成功形成后,从每个节点的配置中删除cluster.initial_master_nodes设置。重新启动群集或将新节点添加到现有群集时,请勿使用此设置。
仅在集群首次启动会使用,其他阶段可以去掉。详见案例五。不过,规范管理起见,配置上不用动就可以了。

discovery.seed_hosts:
   - 192.168.1.10:9300
   - 192.168.1.11
   - seeds.mydomain.com
   - [0:0:0:0:0:ffff:c0a8:10c]:9301
cluster.initial_master_nodes:
   - master-node-a
   - master-node-b
   - master-node-c

Identify the initial master nodes by their node.name, which defaults to their hostname. Ensure that the value in cluster.initial_master_nodes matches the node.name exactly. If you use a fully-qualified domain name (FQDN) such as master-node-a.example.com for your node names, then you must use the FQDN in this list. Conversely, if node.name is a bare hostname without any trailing qualifiers, you must also omit the trailing qualifiers in cluster.initial_master_nodes.
通过默认的主机名node.name标识初始主节点。确保cluster.initial_master_nodes中的值与node.name完全匹配。如果将完全限定的域名(FQDN)(例如master-node-a.example.com)用作节点名称,则必须在此列表中使用FQDN。相反,如果node.name是没有任何尾随限定符的裸主机名,则还必须在cluster.initial_master_nodes中省略尾随限定符。

See bootstrapping a cluster and discovery and cluster formation settings.
请参阅引导群集以及发现和群集形成设置。


index.number_of_shards: 5

设置默认索引分片个数,默认为5片。

index.number_of_replicas: 1

设置默认索引副本个数,默认为1个副本。


#ES默认开启了内存地址锁定,为了避免内存交换提高性能。但是Centos6不支持SecComp功能,启动会报错,所以需要将其设置为false
bootstrap.memory_lock: false

#如果使用elasticsearch-header对集群进行监控时,设置跨域
# 是否支持跨域
http.cors.enabled: true

# *表示支持所有域名
http.cors.allow-origin: "*"
启动服务
sudo systemctl daemon-reload
sudo systemctl enable elasticsearch.service
sudo systemctl restart elasticsearch.service
sudo systemctl status elasticsearch.service
sudo systemctl stop elasticsearch.service

sudo chkconfig --add elasticsearch
sudo chkconfig elasticsearch on
sudo service elasticsearch restart
sudo service elasticsearch status
sudo service elasticsearch stop
rpm --import https://artifacts.elastic.co/GPG-KEY-elasticsearch

vi /etc/yum.repos.d/kibana.repo

[kibana-7.x]
name=Kibana repository for 7.x packages
baseurl=https://artifacts.elastic.co/packages/7.x/yum
gpgcheck=1
gpgkey=https://artifacts.elastic.co/GPG-KEY-elasticsearch
enabled=1
autorefresh=1
type=rpm-md

repo配置同elasticsearch

sudo yum install kibana
修改配置
vi /etc/kibana/kibana.yml
server.port: 5601
server.host: "0.0.0.0"
elasticsearch.hosts: ["http://localhost:9200"]
i18n.locale: "zh-CN"
启动服务
sudo systemctl daemon-reload
sudo systemctl enable kibana.service
sudo systemctl restart kibana.service
sudo systemctl status kibana.service
sudo systemctl stop kibana.service

sudo chkconfig --add kibana
service kibana restart
service kibana status
service kibana stop
repo配置同elasticsearch

sudo yum install logstash

sudo systemctl daemon-reload
sudo systemctl enable logstash.service
sudo systemctl restart logstash.service
sudo systemctl status logstash.service
sudo systemctl stop logstash.service
sudo rpm -Uvh https://packages.graylog2.org/repo/packages/graylog-3.3-repository_latest.rpm
sudo yum update && sudo yum install graylog-server graylog-enterprise-plugins graylog-integrations-plugins graylog-enterprise-integrations-plugins

sudo yum install graylog-server
修改配置
vi /etc/graylog/server/server.conf
passworde_secret: 用于密码加密加盐,集群中的服务器使用同一个密码,必须配置。可以通过命令:pwgen -N 1 -s 96 来随机生成。
root_password_sha2: 用于默认的admin用户登录web的密码,必须配置,可以通过以下命令生成:echo -n yourpassword | sha256sum

修改默认admin用户名:
root_username = jzinfograylog

修改时区为中国PRC:
root_timezone = PRC

配置绑定地址:
http_bind_address = 0.0.0.0:9000

配置外网地址,默认为http_bind_address,因使用了nginx代理,需指定网卡:
http_publish_uri = http://192.168.103.80:9000/

修改elasticsearch主机地址:
elasticsearch_hosts = http://192.168.200.96:9200

修改MongoDB连接地址:
mongodb_uri = mongodb://192.168.203.80:27017/graylog
启动服务
sudo systemctl daemon-reload
sudo systemctl enable graylog-server.service
sudo systemctl restart graylog-server.service
sudo systemctl status graylog-server.service
sudo systemctl stop graylog-server.service

sudo chkconfig --add graylog-server
sudo chkconfig graylog-server on
sudo service graylog-server restart
sudo service graylog-server status
sudo service graylog-server stop
/etc/graylog/sidecar/sidecar.yml
# server_url and server_api_token

sudo graylog-sidecar -service install
sudo systemctl enable graylog-sidecar
sudo systemctl restart graylog-sidecar
sudo systemctl status graylog-sidecar
sudo systemctl stop graylog-sidecar

sudo graylog-sidecar -service install
chkconfig graylog-sidecar on
service graylog-sidecar restart
service graylog-sidecar status
service graylog-sidecar stop
filebeat 不需要启动
#sudo filebeat -service install
#sudo systemctl enable filebeat
#sudo systemctl restart filebeat
sudo systemctl status filebeat
#sudo systemctl stop filebeat

#sudo filebeat -service install
#chkconfig filebeat on
#service filebeat restart
service filebeat status
#service filebeat stop
/etc/mongod.conf

/etc/graylog/sidecar/sidecar.yml
C:\Program Files\Graylog\sidecar\sidecar.yml


/var/lib/graylog-sidecar/generated/filebeat.conf
使用浏览器访问 http://外网ip:9000/,用户名默认为admin、密码在安装Graylog3中生成。
# Graylog Rest API:
firewall-cmd --permanent --zone=public --add-port=9000/tcp

# Graylog Rest INPUTS:
firewall-cmd --permanent --zone=public --add-port=5044/tcp
firewall-cmd --permanent --zone=public --add-port=5045/tcp
firewall-cmd --permanent --zone=public --add-port=5046/tcp
firewall-cmd --permanent --zone=public --add-port=5047/tcp
firewall-cmd --permanent --zone=public --add-port=5047/udp

firewall-cmd --permanent --zone=public --add-port=1514/tcp
firewall-cmd --permanent --zone=public --add-port=1515/tcp

# mongodb:
firewall-cmd --permanent --zone=public --add-port=27017/tcp

# Elasticsearch:

#http.port:对外服务的http端口
firewall-cmd --permanent --zone=public --add-port=9200/tcp

#transport.tcp.port:节点间交互的tcp端口
firewall-cmd --permanent --zone=public --add-port=9300/tcp

# Python2
firewall-cmd --permanent --zone=public --add-port=8000/tcp
# PrometheusAlert
firewall-cmd --permanent --zone=public --add-port=8080/tcp

#重新载入,更新防火墙规则
firewall-cmd --reload

#列出开放的端口
firewall-cmd --list-ports
iptables -I INPUT -i eth0 -p tcp --dport 9000 -j ACCEPT

iptables -I INPUT -i eth0 -p tcp --dport 5044 -j ACCEPT
iptables -I INPUT -i eth0 -p tcp --dport 5045 -j ACCEPT
iptables -I INPUT -i eth0 -p tcp --dport 5046 -j ACCEPT

iptables -I INPUT -i eth0 -p tcp --dport 1514 -j ACCEPT
iptables -I INPUT -i eth0 -p tcp --dport 1515 -j ACCEPT

iptables -I INPUT -i eth0 -p tcp --dport 27017 -j ACCEPT

iptables -I INPUT -i eth0 -p tcp --dport 9200 -j ACCEPT
iptables -I INPUT -i eth0 -p tcp --dport 9300 -j ACCEPT


service iptables save
iptables -n -L INPUT


vi /etc/sysconfig/iptables

-A INPUT -p tcp -m state --state NEW -m tcp --dport 9000 -j ACCEPT

-A INPUT -p tcp -m state --state NEW -m tcp --dport 5044 -j ACCEPT
-A INPUT -p tcp -m state --state NEW -m tcp --dport 5045 -j ACCEPT
-A INPUT -p tcp -m state --state NEW -m tcp --dport 5046 -j ACCEPT

-A INPUT -p tcp -m state --state NEW -m tcp --dport 1514 -j ACCEPT
-A INPUT -p tcp -m state --state NEW -m tcp --dport 1515 -j ACCEPT

-A INPUT -p tcp -m state --state NEW -m tcp --dport 27017 -j ACCEPT

-A INPUT -p tcp -m state --state NEW -m tcp --dport 9200 -j ACCEPT
-A INPUT -p tcp -m state --state NEW -m tcp --dport 9300 -j ACCEPT

service iptables reload
iptables -n -L INPUT
[root@jz-Test-187 ~]# tail -f /var/log/graylog-server/server.log
2020-07-22T14:22:29.905+08:00 WARN  [NodePingThread] Did not find meta info of this node. Re-registering.
2020-07-22T14:22:30.905+08:00 WARN  [NodePingThread] Did not find meta info of this node. Re-registering.

解决:服务器时间未同步,时钟必须同步
[root@jz-Test-187 ~]# sudo service elasticsearch restart
Stopping elasticsearch:                                    [FAILED]
Starting elasticsearch: warning: Falling back to java on path. This behavior is deprecated. Specify JAVA_HOME
此告警没事。
                                                           [FAILED]
此处FAILED有问题,看日志

[root@jz-Test-187 ~]#
[root@jz-Test-187 ~]# tail -f /var/log/elasticsearch/elasticsearch.log
...
[2020-07-22T12:49:45,462][ERROR][o.e.b.Bootstrap          ] [K2oa3PJ] node validation exception
[2] bootstrap checks failed
[1]: max number of threads [1024] for user [elasticsearch] is too low, increase to at least [4096]
[2]: system call filters failed to install; check the logs and fix your configuration or disable system call filters at your own risk
[2020-07-22T12:49:45,463][INFO ][o.e.n.Node               ] [K2oa3PJ] stopping ...
[2020-07-22T12:49:45,472][INFO ][o.e.n.Node               ] [K2oa3PJ] stopped
[2020-07-22T12:49:45,472][INFO ][o.e.n.Node               ] [K2oa3PJ] closing ...
[2020-07-22T12:49:45,479][INFO ][o.e.n.Node               ] [K2oa3PJ] closed

注意到1:max number of threads [1024] for user [elasticsearch] is too low, increase to at least [4096]
vi /etc/security/limits.d/90-nproc.conf

*          soft    nproc     4096
root       soft    nproc     unlimited


注意到2:system call filters failed to install; check the logs and fix your configuration or disable system call filters at your own risk

原因:
这是在因为Centos6不支持SecComp,而ES5.2.0默认bootstrap.system_call_filter为true进行检测,所以导致检测失败,失败后直接导致ES不能启动。
解决:
在elasticsearch.yml中配置bootstrap.system_call_filter为false,注意要在Memory下面:
bootstrap.memory_lock: false
bootstrap.system_call_filter: false
[root@localhost elasticsearch7.12.0]# sudo systemctl restart elasticsearch.service
Job for elasticsearch.service failed because a timeout was exceeded. See "systemctl status elasticsearch.service" and "journalctl -xe" for details.

注意到:timeout was exceeded.

vi /usr/lib/systemd/system/elasticsearch.service
TimeoutStartSec=750
[2021-09-27T06:25:24,677][ERROR][o.e.b.Bootstrap          ] [localhost.localdomain] Exception
org.elasticsearch.ElasticsearchException: Failure running machine learning native code. This could be due to running on an unsupported OS or distribution, missing OS libraries, or a problem with the temp directory. To bypass this problem by running Elasticsearch without machine learning functionality set [xpack.ml.enabled: false].

注意到:To bypass this problem by running Elasticsearch without machine learning functionality set [xpack.ml.enabled: false].

默认是开启机器学习设置的。
注意:机器学习使用SSE4.2指令,因此只能在cpu支持SSE4.2的机器上运行。如果在旧的硬件上运行Elasticsearch,那么需要设置:xpack.ml.enabled为false。

vi /etc/elasticsearch/elasticsearch.yml
xpack.ml.enabled: false
tail -f /var/log/graylog-server/server.log

2021-01-07T10:55:17.643+08:00 WARN  [MessagesAdapterES6] Failed to index message: index=<win_sys_11> id=<b2aa9370-5093-11eb-8dd7-525400aa6619> error=<{"type":"cluster_block_exception","reason":"blocked by: [FORBIDDEN/12/index read-only / allow delete (api)];"}>
2021-01-07T10:55:17.643+08:00 WARN  [MessagesAdapterES6] Failed to index message: index=<win_sys_11> id=<b2aaba80-5093-11eb-8dd7-525400aa6619> error=<{"type":"cluster_block_exception","reason":"blocked by: [FORBIDDEN/12/index read-only / allow delete (api)];"}>
2021-01-07T10:55:17.643+08:00 WARN  [MessagesAdapterES6] Failed to index message: index=<pgsql_1> id=<b2aaba81-5093-11eb-8dd7-525400aa6619> error=<{"type":"cluster_block_exception","reason":"blocked by: [FORBIDDEN/12/index read-only / allow delete (api)];"}>
2021-01-07T10:55:18.427+08:00 WARN  [IndexRotationThread] Deflector is pointing to [graylog_11], not the newest one: [graylog_12]. Re-pointing.
2021-01-07T10:55:18.431+08:00 ERROR [IndexRotationThread] Couldn't point deflector to a new index
org.graylog2.indexer.ElasticsearchException: Couldn't switch alias graylog_deflector from index graylog_11 to index graylog_12

blocked by: [FORBIDDEN/12/index read-only / allow delete (api)];
        at org.graylog.storage.elasticsearch6.jest.JestUtils.specificException(JestUtils.java:110) ~[?:?]
        at org.graylog.storage.elasticsearch6.jest.JestUtils.execute(JestUtils.java:60) ~[?:?]
        at org.graylog.storage.elasticsearch6.jest.JestUtils.execute(JestUtils.java:65) ~[?:?]
        at org.graylog.storage.elasticsearch6.IndicesAdapterES6.cycleAlias(IndicesAdapterES6.java:580) ~[?:?]
        at org.graylog2.indexer.indices.Indices.cycleAlias(Indices.java:318) ~[graylog.jar:?]
        at org.graylog2.indexer.MongoIndexSet.pointTo(MongoIndexSet.java:357) ~[graylog.jar:?]
        at org.graylog2.periodical.IndexRotationThread.checkAndRepair(IndexRotationThread.java:166) ~[graylog.jar:?]
        at org.graylog2.periodical.IndexRotationThread.lambda$doRun$0(IndexRotationThread.java:76) ~[graylog.jar:?]
        at java.lang.Iterable.forEach(Iterable.java:75) [?:1.8.0_172]
        at org.graylog2.periodical.IndexRotationThread.doRun(IndexRotationThread.java:73) [graylog.jar:?]
        at org.graylog2.plugin.periodical.Periodical.run(Periodical.java:77) [graylog.jar:?]
        at java.util.concurrent.Executors$RunnableAdapter.call(Executors.java:511) [?:1.8.0_172]
        at java.util.concurrent.FutureTask.runAndReset(FutureTask.java:308) [?:1.8.0_172]
        at java.util.concurrent.ScheduledThreadPoolExecutor$ScheduledFutureTask.access$301(ScheduledThreadPoolExecutor.java:180) [?:1.8.0_172]
        at java.util.concurrent.ScheduledThreadPoolExecutor$ScheduledFutureTask.run(ScheduledThreadPoolExecutor.java:294) [?:1.8.0_172]
        at java.util.concurrent.ThreadPoolExecutor.runWorker(ThreadPoolExecutor.java:1149) [?:1.8.0_172]
        at java.util.concurrent.ThreadPoolExecutor$Worker.run(ThreadPoolExecutor.java:624) [?:1.8.0_172]
        at java.lang.Thread.run(Thread.java:748) [?:1.8.0_172]
这是因为磁盘空间不足导致的,查看官方文档,可以看到当磁盘的使用率超过95%时,Elasticsearch为了防止节点耗尽磁盘空间,自动将索引设置为只读模式。
在新加硬盘扩大磁盘空间后,还是会提示此错误。
在确认磁盘空间没问题后,删除es索引的read_only标记,即可解决
curl -XPUT -H "Content-Type: application/json" 'http://'${es_ip}'/_all/_settings' -d '{"index.blocks.read_only_allow_delete": null}'
//查询Windows服务器
db.getCollection('sidecars').find({"node_details.operating_system":'Windows'})
//查询Linux服务器
db.getCollection('sidecars').find({"node_details.operating_system":'Linux'})

//模糊查询node_name
db.getCollection('sidecars').find({"node_name": /^.*80.*$/})
//查询相关sidecar节点
db.getCollection('sidecars').find({})

找到对应的node_id,删除即可
Kubernetes集群中的filebeat,部分节点不采集日志,重启之后,查看filebeat日志,不报错,但还是不采集日志。
检查filebeat的日志,发现没有读取Configured paths。最后删除filebeat的数据目录解决。
kubectl logs --tail=100 filebeat-gf546

2023-06-07T03:39:01.533Z        INFO    log/input.go:157        Configured paths: [/opt/log/stash/*/*.log /opt/log/stash/*/*/*.log /opt/log/stash/*/*/*/*.log /var/log/nginx/access.log]

# 解决方法
rm -rf /usr/share/filebeat/*
rm -rf /usr/share/filebeat/.build_hash.txt